Data Storytelling
Telling the Human Impact of San Francisco's Parklets & Public Life Studies
The San Francisco Planning Department wanted to understand the human impacts of their parklet program -- a multi-agency program that flipped parking spaces into 10'x10' public spaces, sponsored by adjacent businesses or organizations. A Parklet is an urban design approach to reclaiming public space from cars by turning parking spaces into public spaces. The SF Planning Department wanted to understand the many ripple effects on neighborhoods and impacts at the block level.
In collaboration with Stae & Openbox, a design research firm, I worked with the City's Planning Department to conduct field interviews with people on the street using intercept surveys and research tools. These interviews helped inform the Planning team on the impacts of their parklet program, neighborhood perception, and how they could operate as additional spaces for people on the block.
![]() Intercept Survey at Luna Reinne Parklet, San Francisco
Intercept Survey at Luna Reinne Parklet, San Francisco
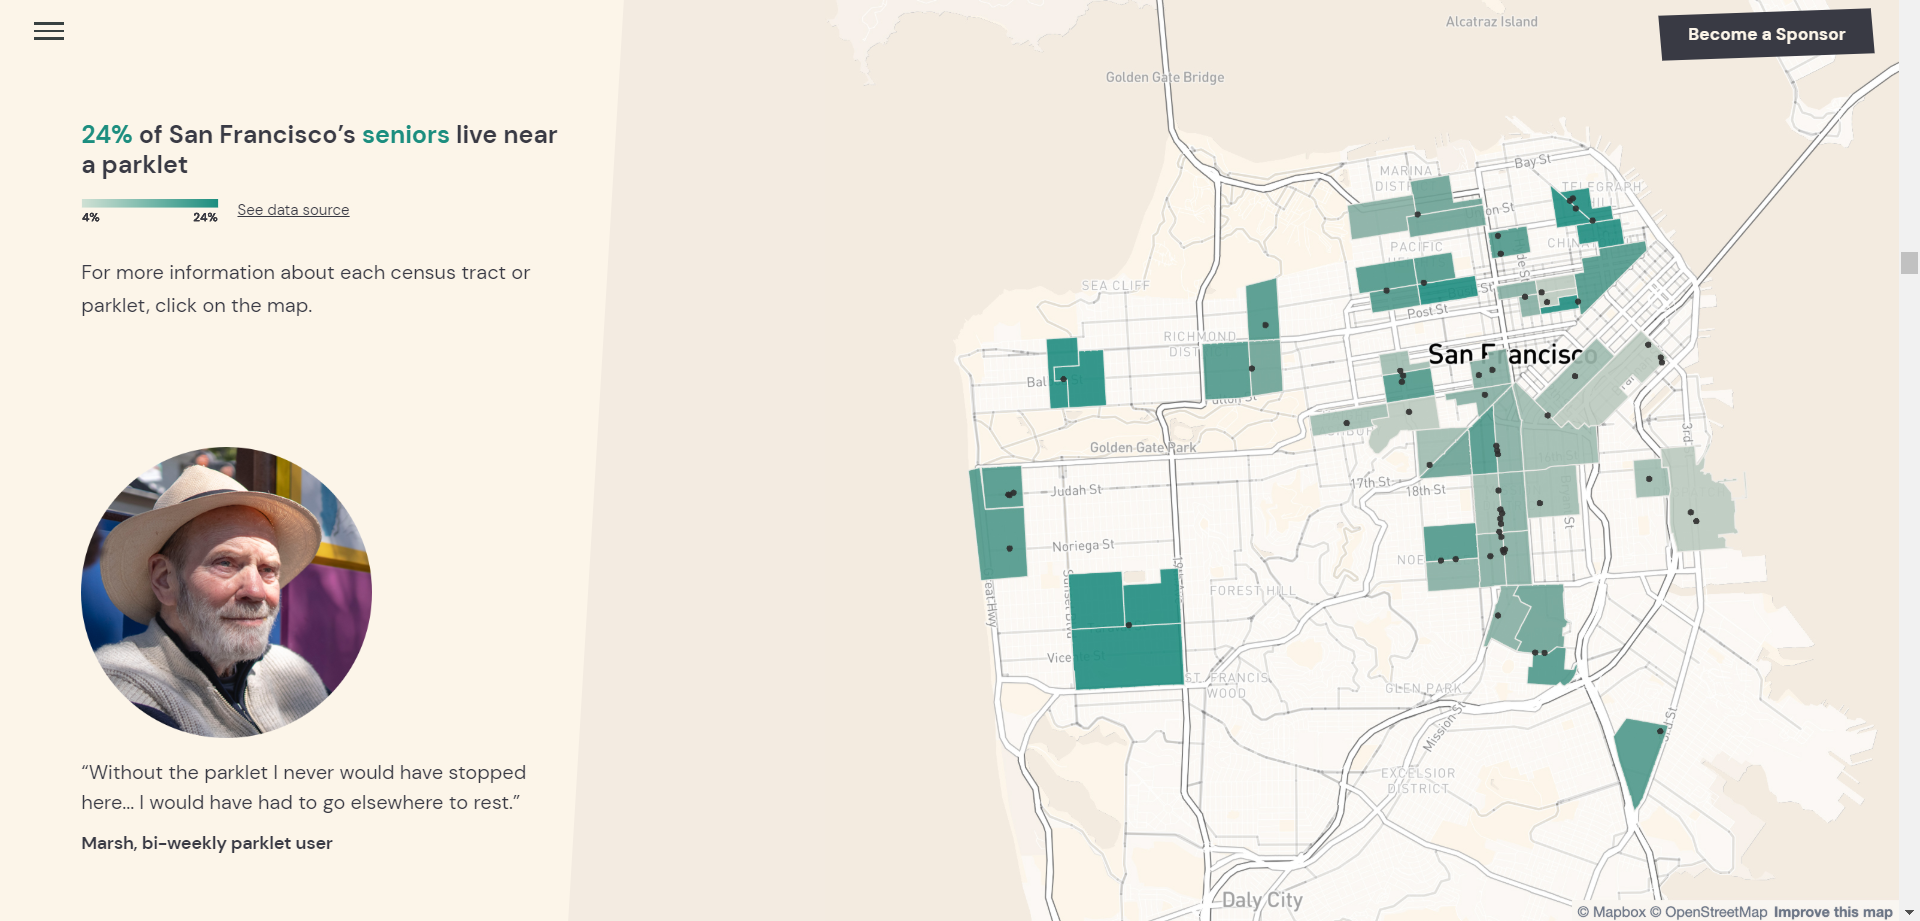
The Planning team also wanted to understand how the city changed as the program matured by incorporating demographic data, survey data, and internal data on their parklet program. Blending quantitative and qualitative sources, the team designed a website that allowed people to explore the data and interviews in an interactive exhibit. I was responsible for creating data visualizations that incorporated contextual City data as well as the stories we learned more about people involved in the Parklet program.
![]()
Case Study: https://medium.com/city-as-a-service/data-design-for-social-inclusion-9e424f3ea80d
Online Exhibit: https://groundplaysf.org/wp-content/parklet-impact-study/
In collaboration with Stae & Openbox, a design research firm, I worked with the City's Planning Department to conduct field interviews with people on the street using intercept surveys and research tools. These interviews helped inform the Planning team on the impacts of their parklet program, neighborhood perception, and how they could operate as additional spaces for people on the block.
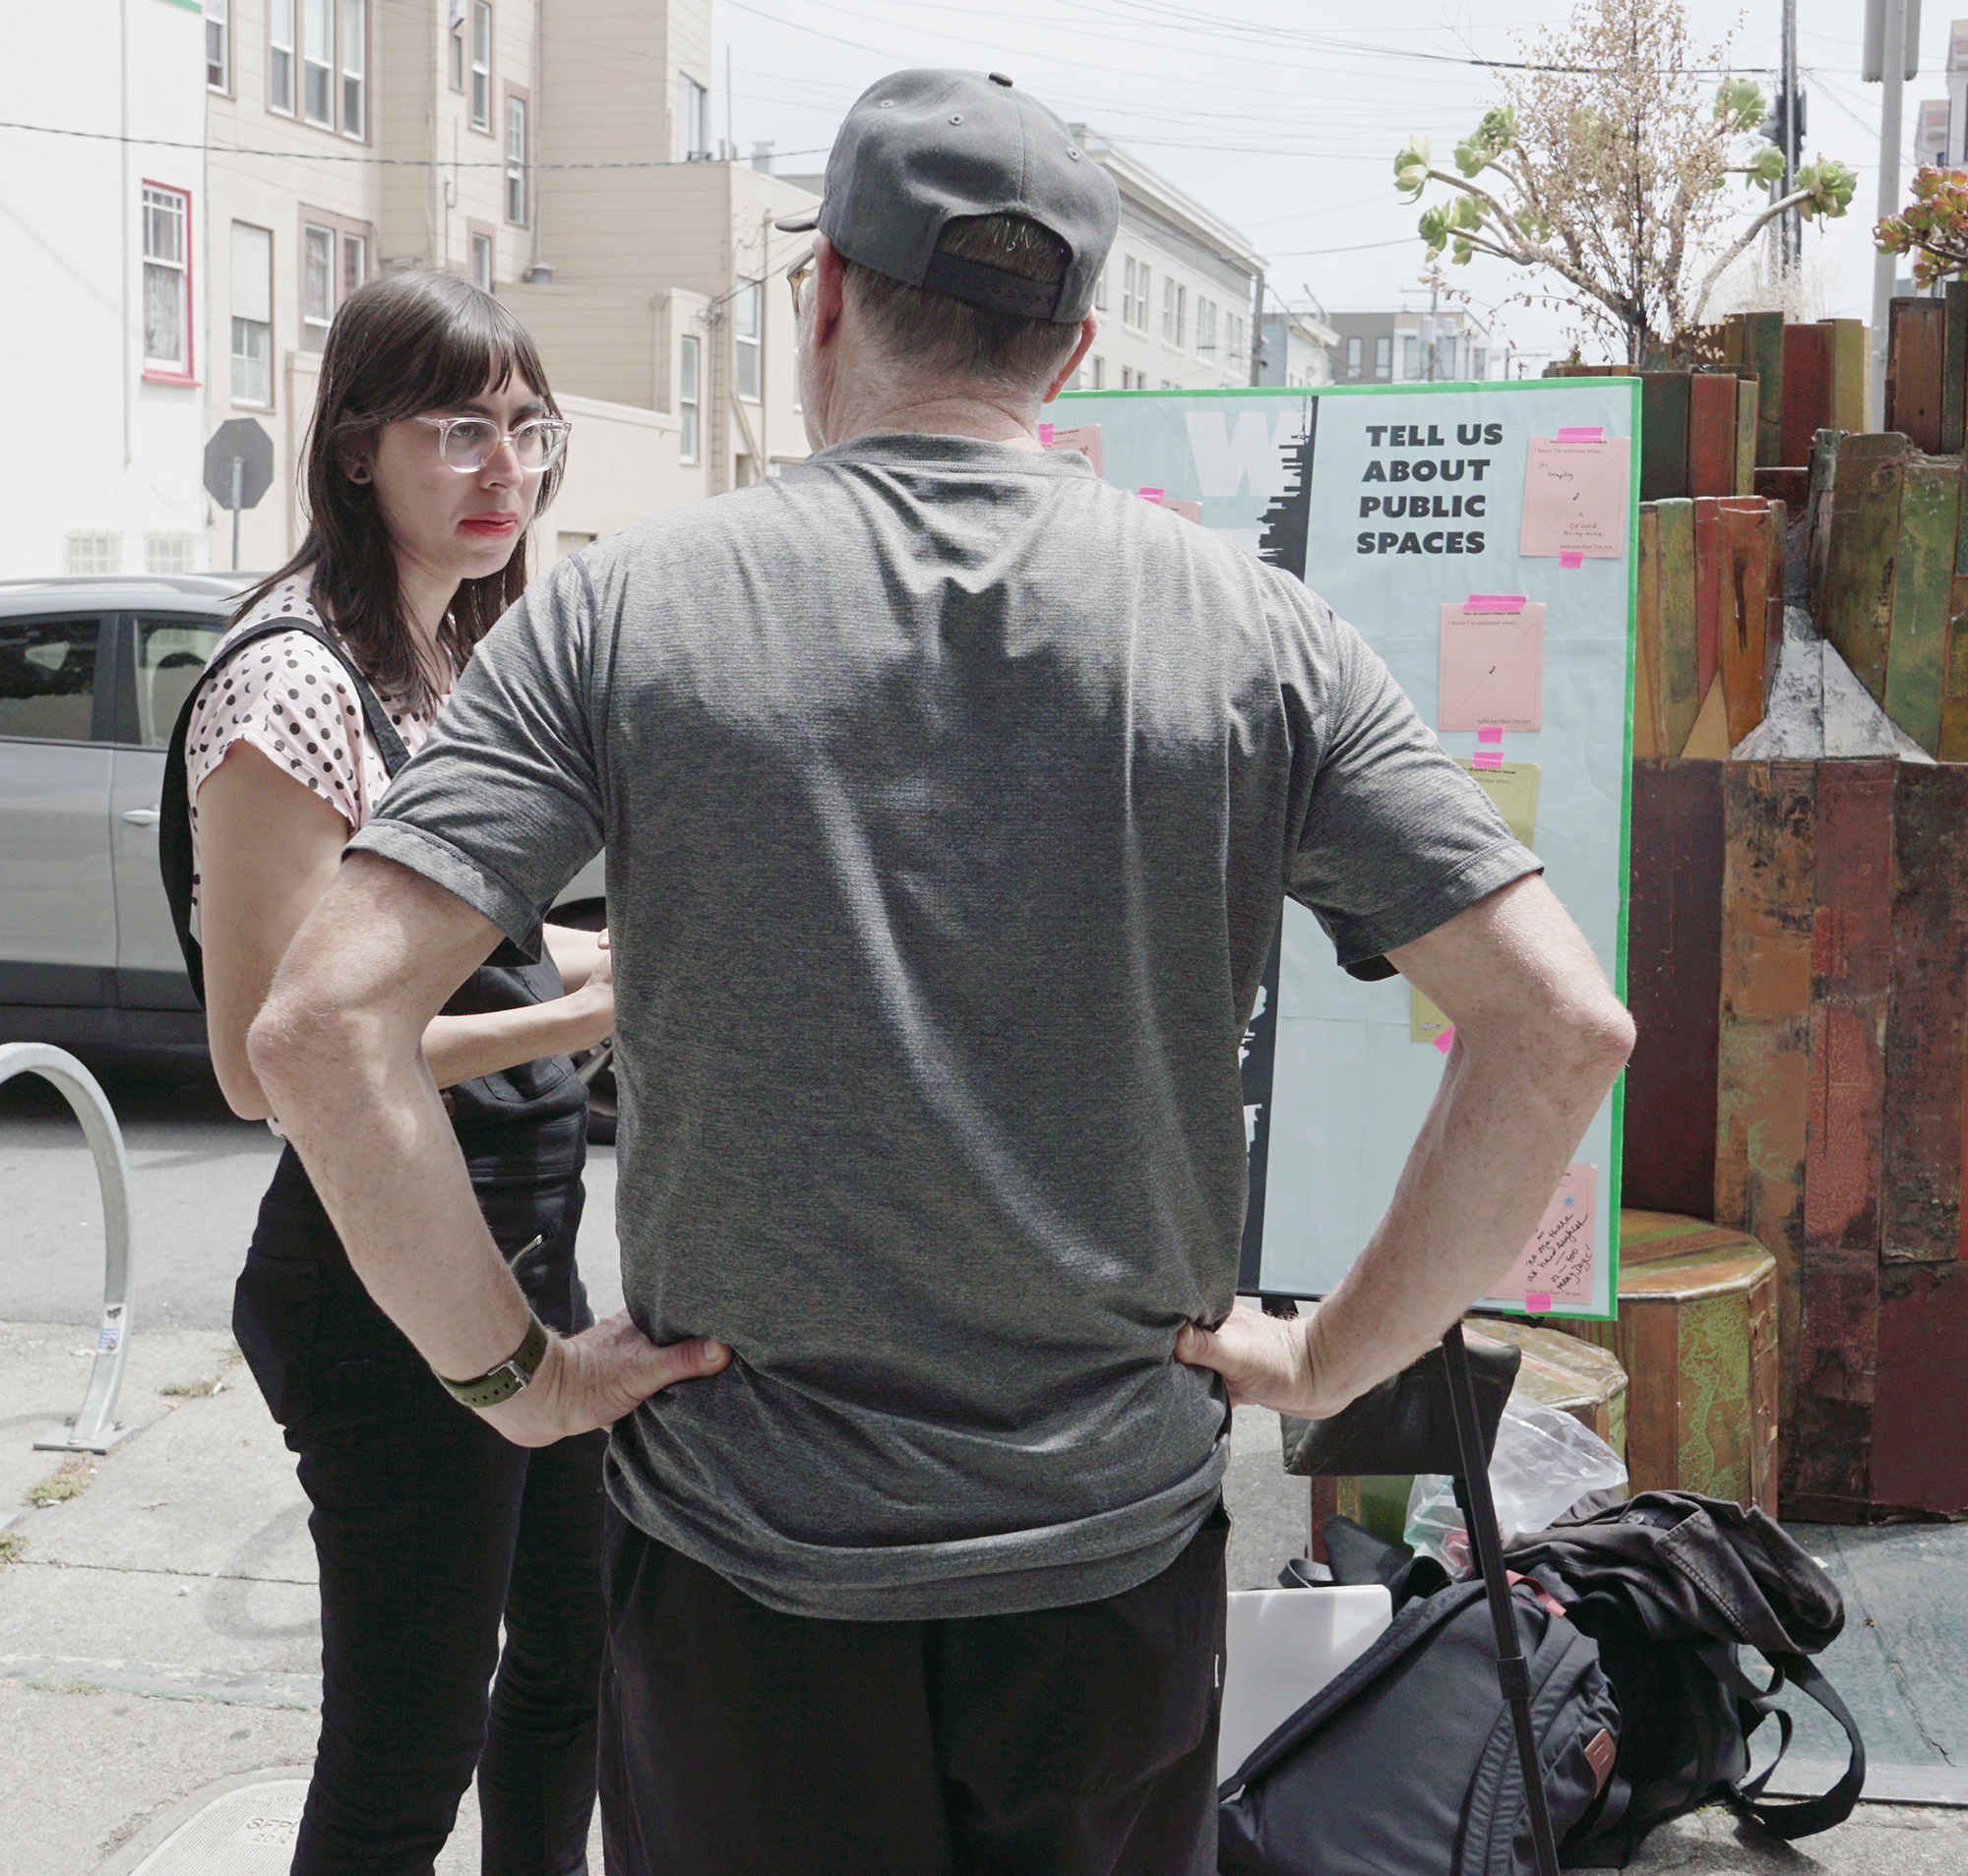 Intercept Survey at Luna Reinne Parklet, San Francisco
The Planning team also wanted to understand how the city changed as the program matured by incorporating demographic data, survey data, and internal data on their parklet program. Blending quantitative and qualitative sources, the team designed a website that allowed people to explore the data and interviews in an interactive exhibit. I was responsible for creating data visualizations that incorporated contextual City data as well as the stories we learned more about people involved in the Parklet program.
Case Study: https://medium.com/city-as-a-service/data-design-for-social-inclusion-9e424f3ea80d
Online Exhibit: https://groundplaysf.org/wp-content/parklet-impact-study/
Guilford County Storytelling
Understanding the impact of varying jurisdictions can be a confusing process but when Jason Jones, Analytics & Innovation Manager for Guilford County, asked the Stae team to help make his work more transparent, we obliged him with a stop-motion video. Before we got to the video, he underscored the work that the County does with other agencies like animal services and non-profit organizations. We used these case studies to inform the content of the video to illustrate how the County incorporates data in its daily work.Case Study: https://medium.com/city-as-a-service/storytelling-data-science-d91d7fd6684b
Guilford County Data Storytelling from Crystal Penalosa on Vimeo
Jason Jones, Analytics & Innovation Manager for Guilford County, describes his role about using data to improve County services.
API / Smart City Explainer Videos
One guiding principle in any of my work is that I should be able to explain it to my younger brothers, grandmother, and Mom. I worked with Adriana Young to develop a video series to explain some more of the tehcnical aspects of civic technology. To do this, we used children's toys to explain how IoT, APIs, and cloud data management works. Adriana did the voice over and script and I designed the sounds and edited it all together. This material would serve as the basis for the marketing content for Stae as we developed content to describe how the product worked.- 60 second explainer: What is Stae?
A stop-motion video I produced with Adriana Young explaining how Stae, a smart city integration platform, works. I shot and edited this video using a Canon 70D and Adobe Premiere Pro.
-
How an API works
This video explains how an API works. I produced this video with Adriana Young for a web series on explaining Smart City technology. I shot and edited this video using a Canon 70D and Adobe Premiere Pro.